

© 2017 QWED Company. All rights reserved. 2017 | Home | Events | Products | Applications | Projects | About | Support | Log In
SOFTWARE PRODUCTS
HARDWARE PRODUCTS
APPLICATIONS
ABOUT
SUPPORT


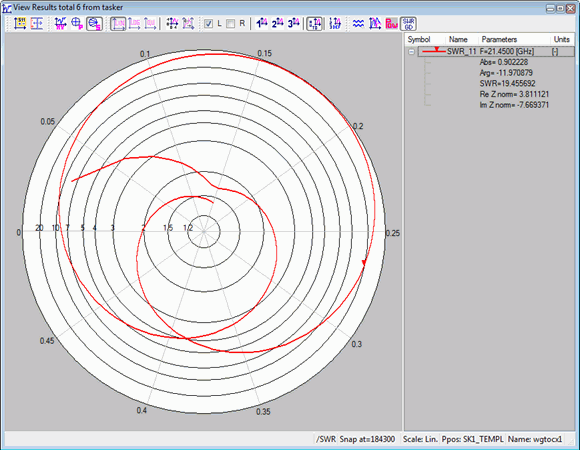
Rieke display for SWR
Following the request of QuickWave software users in microwave power applications, a new option for displaying circuit matching characteristic in a Rieke-compatible diagramme has been provided.
Starting with version 7.5, Setup-Coordinates-Smith option of the View-Results window produces two different charts, depending on the Setup-Switch-SWR&GD switch. When the latter switch is off, a standard Smith chart is displayed, as in previous software versions. When the latter switch is on, a Rieke form of the Smith chart is displayed. In the Rieke chart, the quantity plotted is equal to SWR in magnitude but with the phase of S11. In the radial direction, the Rieke chart spans the whole range of reflection values, from |S11|=0 (SWR=1) at the chart centre to |S11|=1 (SWR-->inf) at the chart outermost circumference.
Scaling in the radial direction is linear in terms of |S11|, gridding is shown in terms of the SWR values. Hence the value in the chart centre is 1 and consecutive rings are placed by default at 1.2 1.5 2.0 3.0 4.0 5.0 7.0 10 20. Different rings, at arbitrary positions, can be enforced by the user through a gridlines.gr3 file in the project directory.
Radial phase lines in the Rieke chart are placed by default at every 0.05 wavelength. Different angular spacing can also be obtained through a gridlines.gr3 file in the project directory.
Example 1: gridlines.gr3 which produces gridding identical to default settings
!YSWRGridLines
1.2 1.5 2.0 3.0 4.0 5.0 7.0 10 20
!XSWRGridLines
0.05
Note that gridlines.gr3 file, if available in the project directory, also controls the gridding in the Setup-Coordinates-XY option with the Setup-Switch-SWR&GD switch on.


discover accurate EM modelling