

© 2017 QWED Company. All rights reserved. 2017 | Home | Events | Products | Applications | Projects | About | Support | Log In
SOFTWARE PRODUCTS
HARDWARE PRODUCTS
APPLICATIONS
ABOUT
SUPPORT


Improvements in View Results window: multiple markers, labels
and saving self explaining pictures
and saving self explaining pictures
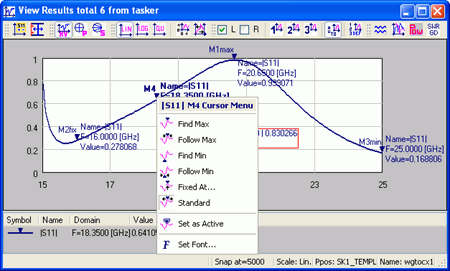
View Results window with multiple markers and cursor context menu
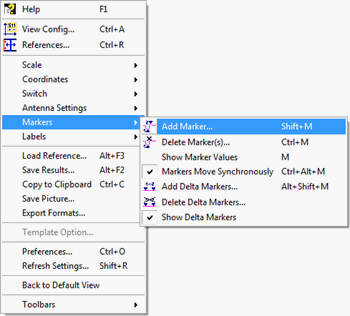
Markers menu in View Results window
Markers functions allow adding, deleting and managing multiple cursors in the View Results window. Via the Add Marker dialogue the user can add marker to the selected visible Curve or to All curves which are visible. After pressing Add button the marker will be added to the Curve or to All curves, and the marker will further behave according to the Function assigned to it by the user. If there is more than one cursor for the curve, the multiple cursors are called markers and have consecutive names, i.e. M1, M2 etc. The Function options selecting one of the following functions for the marker:
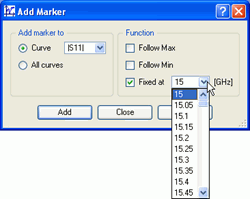
Add Marker dialogue
Note that the markers with chosen Function (M1max, M2fix and M3min) are not movable cursors, because each of them has its own position (maximum, constant position at F=16 GHz and minimum). Only M4 is a movable cursor, because it does not have any special function selected in the Function section. The Domain and Value displayed in the cursor pane are for the Active marker, which is marked by bold text. The user can select the active cursor by pressing left mouse button on the marker, by pressing Alt with left or right keyboard arrow, by pressing Alt with wheel mouse circle, or by pressing Set as Active from the cursor context menu.
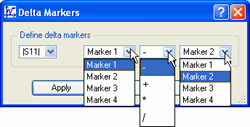
The Delta Markers functions can be added via Delta Markers dialogue. It allows defining the operations between markers for the selected visible curve. There are four operations allowed: addition, subtraction, multiplication and division
The delta markers are displayed in the legend in the form of:
|S11| M1-M3=-4.3500 | 0.830266
The |S11| is the name of the curve; M1-M3 is the operation (subtraction in this case) between M1 and M3 markers, -4.3500 is the result of the domain subtraction (in this case, separation of the two cursors in frequency) and 0.830266 is the result of the values subtraction (in this case, the difference between |S11| values at the two cursors). The | is the separator between domain and value operation results. This text is displayed with the colour corresponding to the curve colour. If Delta Markers are defined for the visible curve and then this curve is hidden, the delta markers show NA (Not Available) result.
The delta markers legend can be moved by pressing left mouse button on the legend (selection indicates the border around the legend) and move it to the new position. The delta markers legend context menu can be accessed by pressing right mouse button on it, and contains the same delta markers choices as in the Markers menu of the View Results window, and additional Set Font position, where the user can change the font for the delta markers legend. It also can be accessed by double click on the selected delta markers legend.
Multiple markers
Delta markers
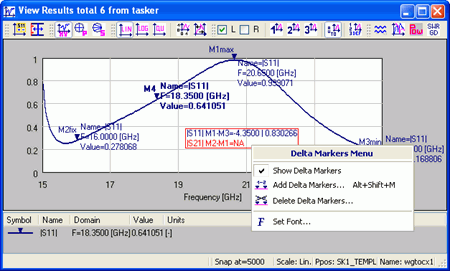
View Results window with delta markers defined and Delta Markers context menu
Labels
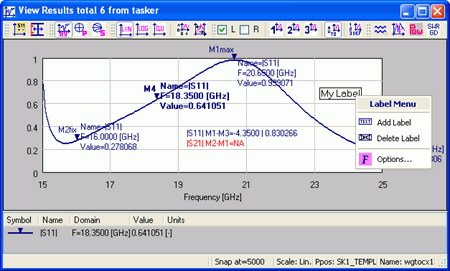
Labels (additional user text) functions allow adding, deleting and managing additional user texts in the View Results window. The label can be added or deleted from the display, selected by pressing left mouse button on the label (selection indicates the border around the label) and moved to the new position. The label context menu can be accessed by pressing right mouse button on it, and contains the same choices as in the Labels menu of the View Results window.
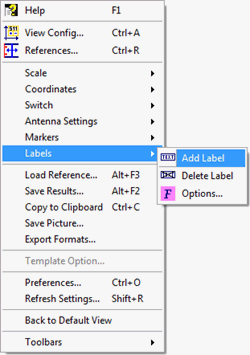
Labels menu in View Results window
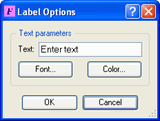
Label Options dialogue
View Results window with additional text label and Labels context menu
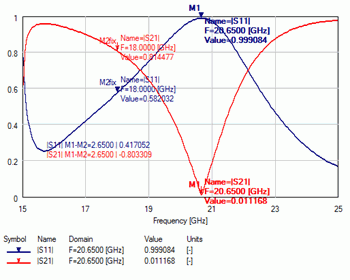
Saving self explaining pictures
The display of the simulation results can be saved as a picture in *.bmp or *.png format. Multiple markers, delta markers, additional labels and cursor pane are also included in the picture.
•
Follow Max - the cursor will be searching for the maximum value of the curve each time the display refreshes. The marker name will be e.g. M1max
•
Follow Min - the cursor will be searching for the minimum value of the curve each time the display refreshes. The marker name will be e.g. M3min
•
Fixed At - the cursor will be constant at point corresponding to the domain value selected from the list. The marker name will be i.e. M2fix


discover accurate EM modelling