

Version 2.0
Version 2.0 of the Quick Wave 3D software package
Dear QuickWave user,
QWED is just introducing a new version 2.0 of QuickWave-3D and QuickWave-V2D electromagnetic simulators. The new version replaces version 1.9 released only few months ago. We did not send an official announcement about version 1.9 to all of our users despite the fact that it was made available from our web page. The reason was that we treated version 1.9 as an intermediate version, with version 2.0 assumed to be the main target for the year 2000. Moreover we tried to get more feedback about the multicurve displays of postprocessing results introduced in version 1.9 from some of our users before it starts to be used by all. Thus we realize that we now have a situation in which some of our users are already experienced with version 1.9 and some others know so far only version 1.8. We encourage both groups to start using version 2.0 now. We assume that the users not familiar with version 1.9 yet will first have a look at the file Update 1.9 and User�s Manual version 1.9 to get aquainted with differences between versions 1.8 and 1.9. We ask all the users to use version 1.9 of the Manual and Help for the next few weeks. We hope that description of the few changes between version 1.9 and 2.0 which we present here will be sufficient to use the new version effectively. We will come up with the Manual and Help update to version 2.0 soon. Here is a brief description of the changes introduced in version 2.0.
1. Plane wave excitation
A possibility of simulating plane wave incidence is important for some applications. Here let us point out analysis of scattering problems or investigation of biological hazards from a plane wave incidence. Plane wave is simulated by introducing a closed surface (called here a "plane wave box") on which virtual surface currents (electric and magnetic) are imposed in such a way that one side of the boundary generates the plane wave and the other side cancels it out. If there is no scattering inside the plane wave box we should have a pure plane wave inside the box and no field outside. If there is scattering or attenuation by objects situated inside the plane wave box some fields outside the box appear. We say that inside the box we have the "total field" and outside the box only the "scattered field". Here is a brief description of the use of the plane wave excitation in QW-3D . We start in the QW-Editor by invoking the command Draw-Plane wave box. After drawing a rectangle with a specific height we obtain a cubicoidal shape of the box. Then we introduce the NTF box (preferably using the UDO supplied on the distribution disk). The plane wave box should be situated entirely inside the NTF box. Now we call Prameters-I/O Ports and select the plane wave box port. In the dialogue window we can set the excitation waveform like for any other active ports. But we can also set two angles (phi and theta) indicating the direction of the plane wave incidence, and polarisation angle. After leaving the I/O Ports dialogue we can also set Parameters- Postprocessing where we have NTF available. We can define here the set of frequencies for which the software will be calculating the far field patterns of the scatterring.
Note: The plane wave excitation has been designed taking into account various error correcting factors. These factors are chosen for best operation on a uniform grid and for the frequency in the middle of the excited band. In such a case the parasitic fields generated at the boundary are more than 65 dB below the level of the plane wave. However it should be noted that the application of non-uniform FDTD grid and/or considering very wide-band spectrum of fields may increase the level of parasitic signals.
2. New definition of the S-matrix below cutoff frequency of waveguides
The problem of the definition of S-matrix in the case of complex or imaginary characteristic impedance of a transmission line may be solved by several approaches. A complete explanation of the problem is beyond the scope of this note. Let us only point out that starting from version 2.0 we switched to the approach called "true S-matrix" by Marks and Williams (Journal of Research of NIST, Boulder Co, vol.97, No.5, Sept.-Oct.1992, p.533-561 ). The main difference appears in Skk parameters calculation at the frequencies below the cut-off frequency of the transmission line used in the k-th port. Let us take for example a straight section of a rectangular waveguide. In version 1.9 and lower we could see that for example S11 below the cut-off frequency was close to unity. This is formally incorrect because reflection coefficient in an infinitely long transmission line should be zero above as well as below cutoff. Thus, starting from version 2.0, the software calculates in such a case correctly
S11�0 for the frequencies below and above the cut-off. Only around cutoff there is a small perturbation because the wave of small attenuation and small phase constants reaches the other end and is partly reflected due to absorbing boundaries poorly working for the waves with phase constant close to zero.
Note: Let us point out that with the imaginary characteristic impedance the real power injected into the k-th port is not proportional to (1-|Skk|2 ). In version 2.0 the power ballance is still calculated from a sum of square roots of S-matrix elements, which is incorrect for the frequencies below the cut-off of the input port. Introduction of the generally correct definition of power ballance requires deeper changes in the postprocessing routines and is planned for future versions of the software.
3. Grids of wires
Some of our customers pointed out that in some specific applications engineers use grids of parallel wires enforcing anisotropic boundary conditions. The E-field component along the wires vanishes, while the component perpendicular to them is not affected. In version 1.9 such a situation could be obtained only by tidious drawing a several parallel wires, each of them enforcing mesh snapping planes.
Technical instructions for fast drawing of wire grids in version 2.0 are given in the Appendix to this note.
4. Upgrade of multicurve result displays
In version 1.9 we introduced multicurve displays of results of analysis with a variety of new functions. Last months permitted us to make the new system more reliable and improve it in many aspects. Let us point out just one of the many new and convenient features. The user can now set two scales displayed of the left and right hand side of the graph, and assign each the curves to one of the scales. This permits to compare more conveniently parameters much differing in value. A typical example may be comparison of behaviour of amplitude and phase characteristics of a device.
5. New V2D axisymmetrical version of QW software
QWED has introduced a new Vector 2D software version for axisymmetrical antennas, resonators, and waveguide discontinuities. QW-V2D software replaced DOS based V2D Solver developed by W.Gwarek and succesfully used by many designers of antenna equipment. It calculates the full-wave solutions assuming axial symmetry of the structure and known angular variation of the exciting field. This approach provides very accurate results in short computing time even for relatively large structures. QW-V2D uses most of the input-output features of QW-3D. It is available as a separate software package or as an option of QW-3D working with the same hardware key.
6. New system of Smn calculations
In version 2.0 we introduced important changes in S-matrix calculation using Smn option. Let us recall that in this option we calculate S-matrix based on reflection and transmission coefficients obtained with consecutive excitations from each of the ports. In version 2.0 we introduced improved formulas for final calculation of S-matrix, which give more accurate results. We also introduced three different modes of operation of the Smn calculation process. In the sequential mode the software performs consecutive calculations from each of the ports with a predefined number of FDTD iterations. This is the only mode which was available in version 1.9. In the multisimulator mode the software opens as many instances of QW-Simulator as many ports are considered, with a different exciting port in each of them. An advantage of such an operation is the possiblity of on-line monitoring of the full S-matrix, calculated for the current number of FDTD iterations. This mode works on single-processor computers; its operation on multiprocessor computers is allowed only if a multiprocessor option of the software has been acquired by the user. The multithread mode of operation is available only to the users, who have the multithread option of QuickWave software for multiprocessor machines. In such a case the software runs different instances on different processors, which decisively saves the computing time. The second and the third option have one disadvantage - increased memory requirements.
7. Power and Q calculation of chosen circuit parts
In version 1.9 the calculation of dissipated power and stored energy was always performed over the entire volume considered in analysis. In version 2.0 we have a possibility to calculate those quantities in chosen parts of the structure. Please note that the dialogue window Power and Q contains a new checkbox "dense regions only". When it is checked, the software takes into account only the regions composed of the media previously declared as having non-zero density in the Parameters-Media window. Thus if we want to calculate the dissipated power or quality factor in a part of a resonator, we should fill this part with a medium of non-zero density and use "dense regions only" option.
8. New result refreshing options
If we wanted to set automatic refreshing of the window with display of results or field distributions in the older versions of the software, the only option available was a dynamic mode, refreshing the display after each iteration. Such an option was often inconvenient because it was significantly slowing down the computing process. Starting from version 2.0 we can choose how frequently the window is to be refreshed. Using the dialogue invoked by Refresh Settings command (available either in Setup group of the active window or by a right mouse button click over that window) we can define the refreshing period in the number of FDTD iterations or in seconds.
9. New options for setting display layouts and colours
Extended qwsim.ini file introduced in version 1.9 allowed flexible definition of display layouts and colours. This possibility is made more user-friendly in version 2.0. The display settings can now be modified from Option command (available either in Setup group of the active window or by a right mouse button click over that window). We can use the new dialogue window to modify the colours of frames, grids and cursors. However this option is not 100% completed. Thus we cannot use the dialogue window yet to change the colour and thickness of the curves describing the results of analysis. We can modify them only in the Init file.
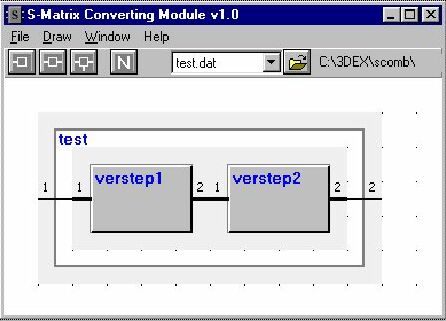
10. New optional module called S-Matrix Converting Module or S-Converter
S-Converter is a new optional software module provided by QWED designed to:
- calculate S-matrix of a multiport structure composed of multiports of known S-matrices (so called to embedding operation)
- calculate S-matrix describing a part of the structure when the S-matrices of other parts and the entire multiport structure are known (so called to deembedding operation).
Partition of a microwave circuit can be done for various reasons. Here are some practical situations providing a rationale for such an operation: - Parts have separate functions and design of each of them separately is simpler. - Electromagnetic simulation of the entire structure would be impractical from the point of view of computer time or/and memory. - Different parts of the structure can be calculated more effectively by different software packages like for example QW-3D and QW-V2D. - In the process of optimization of the structure the optimization variable(s) affect only a part of the structure.
11. Several minor improvements and bug corrections
In version 2.0 we have made many small (but important) improvements in accuracy and bug corrections. We hope that our users will appreciate the changes. These improvements concentrated mostly on QW-Simulator. Let us however signal that our current work concentrates on the task to make the use of QW-Editor simpler and more reliable. We plan to present important changes in this regard in early 2001.
Appendix
QWED Team
Dear QuickWave user,
QWED is just introducing a new version 2.0 of QuickWave-3D and QuickWave-V2D electromagnetic simulators. The new version replaces version 1.9 released only few months ago. We did not send an official announcement about version 1.9 to all of our users despite the fact that it was made available from our web page. The reason was that we treated version 1.9 as an intermediate version, with version 2.0 assumed to be the main target for the year 2000. Moreover we tried to get more feedback about the multicurve displays of postprocessing results introduced in version 1.9 from some of our users before it starts to be used by all. Thus we realize that we now have a situation in which some of our users are already experienced with version 1.9 and some others know so far only version 1.8. We encourage both groups to start using version 2.0 now. We assume that the users not familiar with version 1.9 yet will first have a look at the file Update 1.9 and User�s Manual version 1.9 to get aquainted with differences between versions 1.8 and 1.9. We ask all the users to use version 1.9 of the Manual and Help for the next few weeks. We hope that description of the few changes between version 1.9 and 2.0 which we present here will be sufficient to use the new version effectively. We will come up with the Manual and Help update to version 2.0 soon. Here is a brief description of the changes introduced in version 2.0.
1. Plane wave excitation
A possibility of simulating plane wave incidence is important for some applications. Here let us point out analysis of scattering problems or investigation of biological hazards from a plane wave incidence. Plane wave is simulated by introducing a closed surface (called here a "plane wave box") on which virtual surface currents (electric and magnetic) are imposed in such a way that one side of the boundary generates the plane wave and the other side cancels it out. If there is no scattering inside the plane wave box we should have a pure plane wave inside the box and no field outside. If there is scattering or attenuation by objects situated inside the plane wave box some fields outside the box appear. We say that inside the box we have the "total field" and outside the box only the "scattered field". Here is a brief description of the use of the plane wave excitation in QW-3D . We start in the QW-Editor by invoking the command Draw-Plane wave box. After drawing a rectangle with a specific height we obtain a cubicoidal shape of the box. Then we introduce the NTF box (preferably using the UDO supplied on the distribution disk). The plane wave box should be situated entirely inside the NTF box. Now we call Prameters-I/O Ports and select the plane wave box port. In the dialogue window we can set the excitation waveform like for any other active ports. But we can also set two angles (phi and theta) indicating the direction of the plane wave incidence, and polarisation angle. After leaving the I/O Ports dialogue we can also set Parameters- Postprocessing where we have NTF available. We can define here the set of frequencies for which the software will be calculating the far field patterns of the scatterring.
Note: The plane wave excitation has been designed taking into account various error correcting factors. These factors are chosen for best operation on a uniform grid and for the frequency in the middle of the excited band. In such a case the parasitic fields generated at the boundary are more than 65 dB below the level of the plane wave. However it should be noted that the application of non-uniform FDTD grid and/or considering very wide-band spectrum of fields may increase the level of parasitic signals.
2. New definition of the S-matrix below cutoff frequency of waveguides
The problem of the definition of S-matrix in the case of complex or imaginary characteristic impedance of a transmission line may be solved by several approaches. A complete explanation of the problem is beyond the scope of this note. Let us only point out that starting from version 2.0 we switched to the approach called "true S-matrix" by Marks and Williams (Journal of Research of NIST, Boulder Co, vol.97, No.5, Sept.-Oct.1992, p.533-561 ). The main difference appears in Skk parameters calculation at the frequencies below the cut-off frequency of the transmission line used in the k-th port. Let us take for example a straight section of a rectangular waveguide. In version 1.9 and lower we could see that for example S11 below the cut-off frequency was close to unity. This is formally incorrect because reflection coefficient in an infinitely long transmission line should be zero above as well as below cutoff. Thus, starting from version 2.0, the software calculates in such a case correctly
S11�0 for the frequencies below and above the cut-off. Only around cutoff there is a small perturbation because the wave of small attenuation and small phase constants reaches the other end and is partly reflected due to absorbing boundaries poorly working for the waves with phase constant close to zero.
Note: Let us point out that with the imaginary characteristic impedance the real power injected into the k-th port is not proportional to (1-|Skk|2 ). In version 2.0 the power ballance is still calculated from a sum of square roots of S-matrix elements, which is incorrect for the frequencies below the cut-off of the input port. Introduction of the generally correct definition of power ballance requires deeper changes in the postprocessing routines and is planned for future versions of the software.
3. Grids of wires
Some of our customers pointed out that in some specific applications engineers use grids of parallel wires enforcing anisotropic boundary conditions. The E-field component along the wires vanishes, while the component perpendicular to them is not affected. In version 1.9 such a situation could be obtained only by tidious drawing a several parallel wires, each of them enforcing mesh snapping planes.
Technical instructions for fast drawing of wire grids in version 2.0 are given in the Appendix to this note.
4. Upgrade of multicurve result displays
In version 1.9 we introduced multicurve displays of results of analysis with a variety of new functions. Last months permitted us to make the new system more reliable and improve it in many aspects. Let us point out just one of the many new and convenient features. The user can now set two scales displayed of the left and right hand side of the graph, and assign each the curves to one of the scales. This permits to compare more conveniently parameters much differing in value. A typical example may be comparison of behaviour of amplitude and phase characteristics of a device.
5. New V2D axisymmetrical version of QW software
QWED has introduced a new Vector 2D software version for axisymmetrical antennas, resonators, and waveguide discontinuities. QW-V2D software replaced DOS based V2D Solver developed by W.Gwarek and succesfully used by many designers of antenna equipment. It calculates the full-wave solutions assuming axial symmetry of the structure and known angular variation of the exciting field. This approach provides very accurate results in short computing time even for relatively large structures. QW-V2D uses most of the input-output features of QW-3D. It is available as a separate software package or as an option of QW-3D working with the same hardware key.
6. New system of Smn calculations
In version 2.0 we introduced important changes in S-matrix calculation using Smn option. Let us recall that in this option we calculate S-matrix based on reflection and transmission coefficients obtained with consecutive excitations from each of the ports. In version 2.0 we introduced improved formulas for final calculation of S-matrix, which give more accurate results. We also introduced three different modes of operation of the Smn calculation process. In the sequential mode the software performs consecutive calculations from each of the ports with a predefined number of FDTD iterations. This is the only mode which was available in version 1.9. In the multisimulator mode the software opens as many instances of QW-Simulator as many ports are considered, with a different exciting port in each of them. An advantage of such an operation is the possiblity of on-line monitoring of the full S-matrix, calculated for the current number of FDTD iterations. This mode works on single-processor computers; its operation on multiprocessor computers is allowed only if a multiprocessor option of the software has been acquired by the user. The multithread mode of operation is available only to the users, who have the multithread option of QuickWave software for multiprocessor machines. In such a case the software runs different instances on different processors, which decisively saves the computing time. The second and the third option have one disadvantage - increased memory requirements.
7. Power and Q calculation of chosen circuit parts
In version 1.9 the calculation of dissipated power and stored energy was always performed over the entire volume considered in analysis. In version 2.0 we have a possibility to calculate those quantities in chosen parts of the structure. Please note that the dialogue window Power and Q contains a new checkbox "dense regions only". When it is checked, the software takes into account only the regions composed of the media previously declared as having non-zero density in the Parameters-Media window. Thus if we want to calculate the dissipated power or quality factor in a part of a resonator, we should fill this part with a medium of non-zero density and use "dense regions only" option.
8. New result refreshing options
If we wanted to set automatic refreshing of the window with display of results or field distributions in the older versions of the software, the only option available was a dynamic mode, refreshing the display after each iteration. Such an option was often inconvenient because it was significantly slowing down the computing process. Starting from version 2.0 we can choose how frequently the window is to be refreshed. Using the dialogue invoked by Refresh Settings command (available either in Setup group of the active window or by a right mouse button click over that window) we can define the refreshing period in the number of FDTD iterations or in seconds.
9. New options for setting display layouts and colours
Extended qwsim.ini file introduced in version 1.9 allowed flexible definition of display layouts and colours. This possibility is made more user-friendly in version 2.0. The display settings can now be modified from Option command (available either in Setup group of the active window or by a right mouse button click over that window). We can use the new dialogue window to modify the colours of frames, grids and cursors. However this option is not 100% completed. Thus we cannot use the dialogue window yet to change the colour and thickness of the curves describing the results of analysis. We can modify them only in the Init file.
10. New optional module called S-Matrix Converting Module or S-Converter
S-Converter is a new optional software module provided by QWED designed to:
- calculate S-matrix of a multiport structure composed of multiports of known S-matrices (so called to embedding operation)
- calculate S-matrix describing a part of the structure when the S-matrices of other parts and the entire multiport structure are known (so called to deembedding operation).
Partition of a microwave circuit can be done for various reasons. Here are some practical situations providing a rationale for such an operation: - Parts have separate functions and design of each of them separately is simpler. - Electromagnetic simulation of the entire structure would be impractical from the point of view of computer time or/and memory. - Different parts of the structure can be calculated more effectively by different software packages like for example QW-3D and QW-V2D. - In the process of optimization of the structure the optimization variable(s) affect only a part of the structure.
11. Several minor improvements and bug corrections
In version 2.0 we have made many small (but important) improvements in accuracy and bug corrections. We hope that our users will appreciate the changes. These improvements concentrated mostly on QW-Simulator. Let us however signal that our current work concentrates on the task to make the use of QW-Editor simpler and more reliable. We plan to present important changes in this regard in early 2001.
Appendix
QWED Team

© 2017 QWED Company. All rights reserved. 2017 | Home | Events | Products | Applications | Projects | About | Support | Log In
SOFTWARE PRODUCTS
HARDWARE PRODUCTS
APPLICATIONS
ABOUT
SUPPORT


discover accurate EM modelling